
Short version: This Black Friday weekend is a relevant time to attempt to press my thoughts on consumerism into a post. A revealing ONS data set about household spending. Also some thoughts on blogging and whales’ heart beats.
A note on structure
On top of a tangled set of thoughts about consumption, there was a lot of interesting content to read, listen to, and watch on this topic. The structure of this post suffered, and so if you’re just here to skim I suggest scroll down to the bottom and just check out Trends from the data and Whales’ Heart Beats.
Consumerism
I want stuff. Lots of people also want stuff. Often, if they can, they go out and buy stuff. This is a simple thought, but the many paths it leads down have been a tangle in my mind for some time. This post is an attempt to rectify the clash between the obvious value in markets and trade with the absurdity of waste (see the two videos below) in modern developed economies. This is highlighted by celebrations of consumerism that occur after Thanksgiving.
Chasers War on Waste
The true cost of fast fashion | The Economist
People want to be rich
I think it is reasonable to presume the overwhelming majority of people would like to have more money. Money provides security, safety, and freedom (and most of lower tiers of Maslow’s hierarchy of needs). Casey Neistat points out that for a lot of people, money will solve all problems. although people with plenty of money still have problems.
This simple desire for material wealth gets complicated by how different that desire looks at different points of time. The majority of people in the developed world have access to goods and services that were restricted to only the most wealthy only decades ago. Advances in agriculture and medicine mean even the poorest citizens have access to goods like pineapples and penicillin that would have been unimaginable to emperors and kings of centuries past. This Louis CK bit makes light of changing expectations. That desire for newer and shinier at the expense of appreciation for what we already have is, in part, created by the desire for companies to grow their sales and profits. An array of narratives are pushed through advertising. A particularly disturbing yet powerful lie is that you can change who you are simply by owning something. The idea that you can be fitter/sexier/smarter by buying something, rather than by learning or growing, sells a lot of products, despite failing their buyers.
School of Life: History of Consumerism
Black Friday
Black Friday is a day of discounted selling by retailers following Thanksgiving Day, which is observed by shops throughout much of the world. Scenes of people rushing into stores and fighting over relatively cheaper items are symbolic of a period of significant spending by consumers as the end of the year, and particularly Christmas, approaches.
A lot of people work in retail. In Australia, it is 1.3 million, nearly 10% of the labour force. This is an enormous amount of human life dedicated to the mere act of selling things (1.8 Australian lifetimes is spent per working hour by the collective in shops, life expectancy in Australia = 82.5 years). Intuitively (and so simplistically as to be utterly inaccurate) this struck me as a waste of time, given retail exists as a middle man between producers and consumers. Of course in reality at points retailers make the entire system more efficient (for example by collecting fruit and milk in bulk and distributing it to stores in lieu of each consumer visiting a farm individually), but in practice profit incentives drive this enormous work force to motivate us all to consumer more.
One way consumption is driven is through pricing. The decision to purchase an item is in part determined by the price attached to that item. Commonly items are priced at X.99 rather than X+1, because that centipoint increase is far more psychologically significant than the additional profit. A further extreme of this is quantum pricing where fewer price points mean profit margins are obfuscated. The discounts of Black Friday create the perception that shoppers are saving money by buying things at a lower price than they would otherwise, combined with a false scarcity that this is the only time to buy. In reality most consumer goods depreciate rapidly so any future time is a better time to buy. Less scrupulous stores raise prices before the sales only to mark down to pre-sale prices. One clear sign of the power of this frenzied overconsumption is the willingness for people to take on debt to purchase luxuries. Loan Sharks take advantage of Black Friday pressures to consume.
Interesting observations from some actual data
A few weeks ago I came across the BBC series “My Money“, which takes individuals and looks at their spending over a week. My fascination with how other people spend money stems from not having a good answer to “What is the appropriate/correct/optimal amount to spend on X”. There are intuitive answers to this, which is why spending £100 a week on cheese or £5 a quarter on electricity “feel” high and low, but that intuition is shaped by our relatively limited insight into other’s spending (likely dominated by our parents’ and partners’ habits) augmented by the media we consume, particularly the coercive forces of marketing.
I am consistently frustrated with the concept of normal. There are no “normal” people in the same way there is no way to roll 3.5 (the centre of the normal distribution for values) on a 6 sided die. This video featuring wrestler John Cena emphasises the difficulty in describing an “average” american. However discovering the UK’s Office of National Statistics collects and compiles data on household expenditure (among other things), and produces reports on the distribution of spending, provides data on where the distributions actually lie. I found exploring the data fascinating. I was particularly excited to find this data set breaking down typical weekly expenditure by item in pretty specific categories (e.g. “Cheese”, “Books”, and “Package Holidays – UK” are separate categories).
Here are some observations:
The big picture: income and expenditure
The distribution of incomes in the UK gives an insight into what households can actually afford.
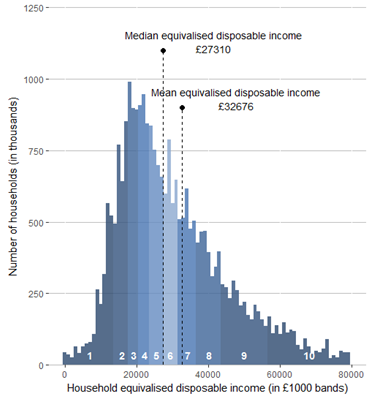
The interactive graphic below gives insight into how the typical UK household spends (taken from this ONS report).
Trends from the data
General trends
A wealthier decile has more people per household.
Wealth increases steadily between the 2nd and 8th deciles, and sharply at both ends.
Overall spending trends
Spending in most product areas correlates with increasing disposable income on both a per person and per capita level.
Interesting specific spending trends
Food
Poultry (strongly) and beef (weakly) correlate with increasing wealth, pork and lamb are flat across groups, and bacon and ham have a weak negative correlation.
Housing
Poorer households spend proportionally much more on housing, making up 19.1 % of spending for the lower half of households, vs 11.1 % for the upper (I guess this is because of renting vs owning). This is after accounting for housing benefits to the lowest deciles.
Transport
Transport spending is correlated with income, with a sharp increase in the top decile due to the purchase of new (presumably luxury) cars.
Clothes
In the bottom three deciles women spend 2.5x more than than men on clothes, whereas that ratio is only 1.3x for the top decile.
Only the top few deciles use drycleaning services.
Alcohol and Tobacco
Spending on alcoholic drinks was correlated with income, but the trend was dominated by wine, while beer and spirits were fairly independent across the groups.
Lower income deciles spent more per person on tobacco and other narcotics.
Health and Education
Education (school fees) and sports subscriptions (gyms) correlated strongly with income.
Entertainment
There is a hump like feature in the audio-visual equipment categories in the 6th and 7th deciles.
Spending on hotels appears to have an exponential relationship with increasing disposable income.
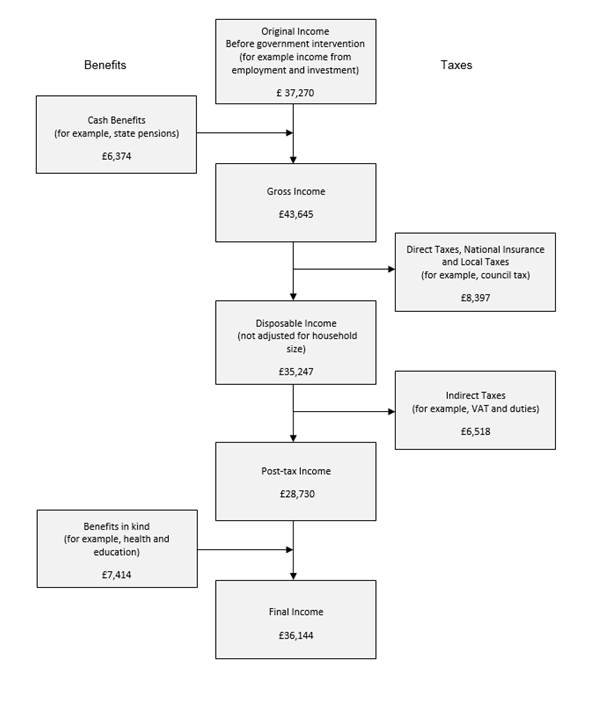
Statistical definitions
Useful definitions from the ONS:
What is disposable income?
Disposable income is arguably the most widely used household income measure. Disposable income is the amount of money that households have available for spending and saving after direct taxes (such as Income Tax, National Insurance and Council Tax) have been accounted for. It includes earnings from employment, private pensions and investments as well as cash benefits provided by the state.
The five stages are:
1. Household members begin with income from employment, private pensions, investments and other non-government sources; this is referred to as “original income”
2. Households then receive income from cash benefits. The sum of cash benefits and original income is referred to as “gross income”.
3. Households then pay direct taxes. Direct taxes, when subtracted from gross income is referred to as “disposable income”.
4. Indirect taxes are then paid via expenditure. Disposable income minus indirect taxes is referred to as “post-tax income”.
5. Households finally receive a benefit from services (benefits in kind). Benefits in kind plus post-tax income is referred to as “final income”.
Note that at no stage are deductions made for housing costs.
Amusing group names:
While looking at consumer spending in the UK, I found the following categories that the ONS uses to divide UK residents. Some of them were incredulous to the point of being amusing.
Categories:
Rural residents, Cosmopolitans, Ethnicity central, Multicultural metropolitans, Urbanites, Suburbanites, Constrained city dwellers, Hard-pressed living
Sub-categories:
Farming Communities, Rural Tenants, Ageing Rural Dwellers, Students Around Campus, Inner-City Students, Comfortable Cosmopolitans, Aspiring and Affluent, Ethnic Family Life, Endeavouring Ethnic Mix, Ethnic Dynamics, Aspirational Techies, Rented Family Living, Challenged Asian Terraces, Asian Traits, Urban Professionals and Families, Ageing Urban Living, Suburban Achievers, Semi-Detached Suburbia, Challenged Diversity, Constrained Flat Dwellers, White Communities, Ageing City Dwellers, Industrious Communities, Challenged Terraced Workers, Hard-Pressed Ageing Workers, Migration and Churn.
Personal conflict: running tech
I like running, and improving my fitness more generally, I suppose because it helps me to self actualise. One of my personal weaknesses in fighting back against the commercial marketing machine has been in running tech. As such, I found this video from the New York Times both entertaining and helpful in realising the main thing I need to run faster is not a piece of equipment, but to simply run more and faster.
December blogging reflection
Lately I’ve been posting each week on Sunday come what may. There’s a pretty wide variance in how much time goes into each post, which is not always related to the quality of each post. Some topics I have a better understanding of before I start to write. Some observations are not insightful. Some posts go out unfinished.
Ideas vary in quality. Some ideas were probably not worth writing about at all, while others are so huge they could easily fill hundreds of pages. Not every idea is a good idea, and even a good idea poorly executed is not a good result.
Some topics deserve to be revisited, edited, improved, expanded etc. But writing in this weekly format is useful. Sometimes quantity results in quality. If I maintained a high expectation for each blog post I would write less, and my writing would not improve. Moreover in trying to write each week I am motivating myself to learn. I do hope to better organise myself in the next block of blogging (i.e. next year’s posts) to segregate space for tackling bigger topics less frequently, with a less structured more regular section.
As I was writing this post I received Peter Attia’s weekly email, describing his struggles with writing. It was extremely motivating to read words that felt so familiar they could have been my own. I would not wish insecurities on anyone, but it is deeply reassuring to be reminded those feelings are normal.
While on the topic of other writers; blogs I’d like to share:
Econometrics By Simulation: interesting applications of statistical software.
Beau Miles: Came across some of his films, the first content in a while to make me really miss Australia. Describes himself as “Award winning filmmaker, poly-jobist, speaker, writer, odd.”
Whales’ heart beats
A wonderful aspect of having scientists as friends is that they share exciting science with you that you would otherwise miss. One example is this paper about how the heart rate of blue whales changes as they dive for food. Their enormous hearts beat as slowly as two times per minute and as quickly as 37, which is about as fast as is physically possible. It also contains this informative figure, which I feel tells the story clearly and succinctly.
Photos from the Week

Bridges to run 
Port Meadow still Flooded 
Christmas Markets in Oxford


One Reply to “2019 Week 48: Consumption”