
Short version: Intuitions about how we look at data. Taking small steps with code. Art at the Tate Modern.
Long version:
Sneaky Spreadsheets
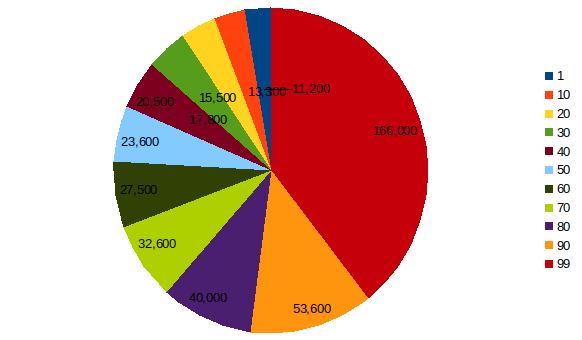
This week I have been processing some experimental data and realised how the same data can be plotted in seemingly different ways. Often looking at the numbers themselves can be challenging, particularly if there are hundreds of points with multiple values at each point. For this example we take some simple data about income distribution in the UK. The numbers alone are accurate but making inferences takes consideration and a little mental arithmetic.
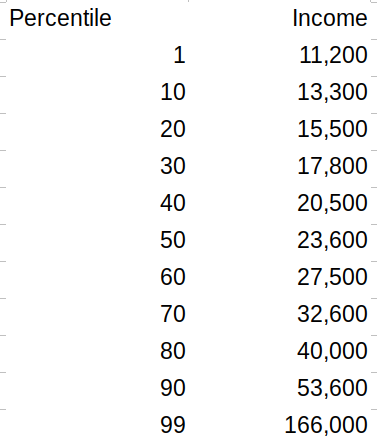
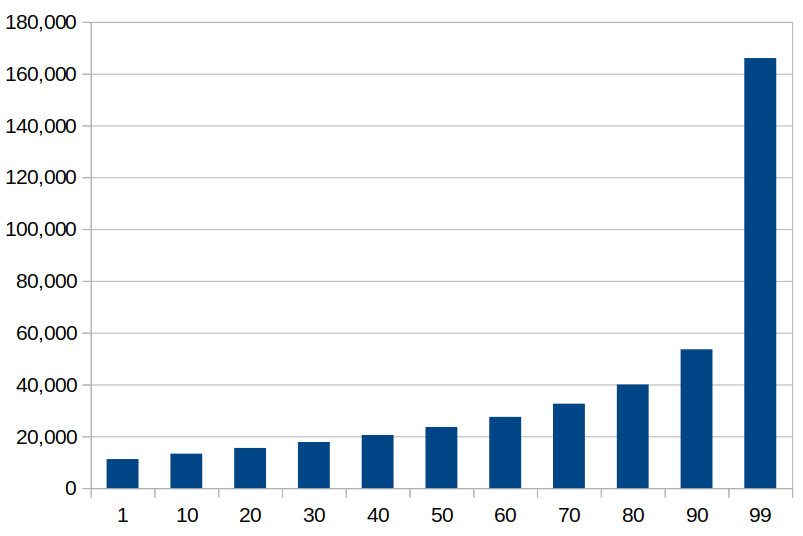
A linear column chart is the simplest and fastest way to visualise the data in a spreadsheet program (excel, google sheets, open office calc). It shows the 99th percentile as much larger than the other values, and the increases seem bigger between the higher percentiles.
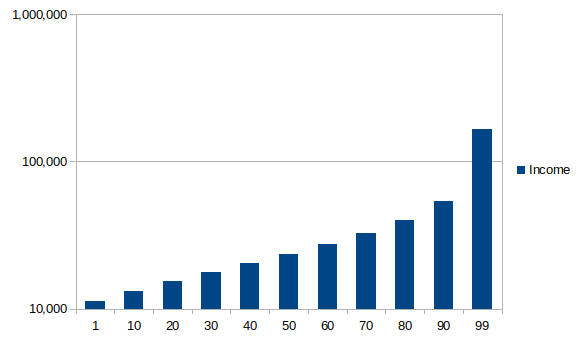
Taking a logarithmic plot makes each step along the distribution seem more even, but the 99th percentile still seems noticeably larger.
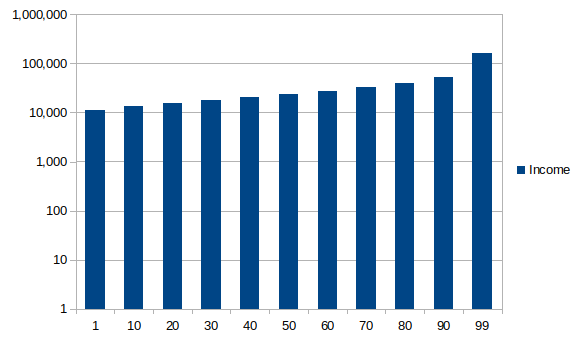
But by changing the minimum axis value on a logarithmic plot the distribution seems much flatter overall.
And we can go to the opposite extreme, by plotting a pie chart the high income earners (top 1%) seem to take a massive share of the pie.
Code
I am not proficient in code, and find that embarrassing. That is an odd statement, I’m not proficient at many things (skateboarding, Portuguese speaking, cello playing) but few of those things cause me to feel embarrassment. Technological proficiency, unlike skating or playing a string instrument, is a part of my identity, and I feel that being able to code (or at least write basic scripts) is a part of being good with tech. When I go to write code, I am confronted by the gap between what I feel my skill should be and where my skills actually are, which is uncomfortable. Moreover it causes me to hide, refraining from asking for help, and I end up doing things in a slow and repetitive way. To push back against that urge, here is an attempt to write a simple python script to extract folder information from a directory tree.
import os
import re
print "This removes files from saved directory trees"
path = "./"
print "I will run in the local folder"
linecount = 0
for filename in os.listdir(path):
        if filename[len(filename)-4:]==".txt":
            with open(os.path.join(path, filename), "r") as file:
                output= open(filename[0:len(filename)-4]+"_folders.txt","w+")
                for line in  file:
                    if len(line) > 6:
                        if line[len(line)-6]!=".":
                            if line[len(line)-5]!=".":
                                if line[len(line)-6:]!="Cloud\n":
                                    output.write(line)
                                    linecount = linecount +1
            print("I found "+str(linecount)+" lines and put them into "+filename[0:len(filename)-4]+"_folders.txt")
            linecount = 0
        else:
            print("I did not process "+filename)
            linecount = 0
Subscribe to email alerts!
|
Photos from the week


From the Tate Modern exhibition by Olafur Eliasson